

Why are my BullMQ jobs stuck? Debugging waiting, active, delayed and failed jobs



Why are my BullMQ jobs stuck?
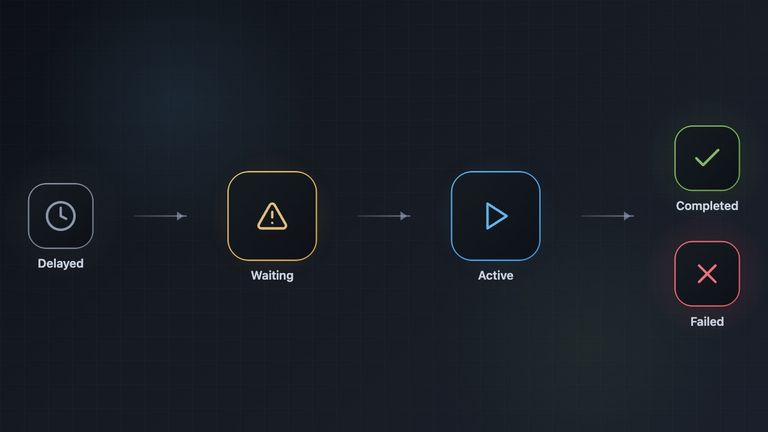
When BullMQ jobs are not being processed, the first step is to find out which state they are stuck in. Each state has a small set of usual causes:
- Waiting: no worker is consuming the queue, or the worker uses a different queue name or connection. The queue may also be paused, rate limited or at its concurrency limit.
- Active: the processor never finishes, or the worker died and no other worker is running to recover the job.
- Delayed: the delay or retry backoff hasn't expired yet, or no worker is running to promote the job.
- Waiting-children: the job is the parent in a flow and some of its children haven't completed.
- Failed: the job threw an error, stalled too many times or lost its lock.
Most of this guide applies to both BullMQ backends, Redis and PostgreSQL. Where they differ, the PostgreSQL details are noted.
Start with a dashboard, not a script
BullMQ has methods for every check in this guide, but in production you usually can't just open a console and call them. Running a one-off script means deploying code, or opening a tunnel from your laptop to a Redis or PostgreSQL server that should not be reachable from outside. During an incident, neither is quick.
A dashboard connected to the queue reads the same data and lets you act on it. Each section below starts with what to look for in a dashboard, then shows the equivalent code for local debugging or for building your own tools. The two common options are:
- Taskforce.sh, the hosted dashboard made by the BullMQ team. The open source Taskforce Connector runs next to Redis or PostgreSQL (version 1.39 or later for PostgreSQL) and opens an outgoing connection, so the database stays in your private network. It shows job counts, paused queues, connected workers, job data, logs and stack traces, and lets you retry, promote, clean, pause and resume. Monitors send alerts by email, Slack or PagerDuty when jobs fail, workers disappear or a backlog grows, and custom roles let you give support staff access to some actions only.
- Bull Board, a free, open source UI that you mount inside your own app. It shows jobs by state with their data and errors, and lets you retry, promote and clean them. It's a good choice if it's already deployed, but adding it during an incident means a deploy, and it has no alerts.
How to monitor and manage BullMQ queues compares these and other options in more detail.
Step 1: look at the job counts
In a dashboard: open the queue. The overview shows how many jobs are in each state, whether the queue is paused and how many workers are connected. This alone usually tells you which section of this guide to read.
From code:
import { Queue } from "bullmq";

const queue = new Queue("emails", { connection });

console.log(await queue.getJobCounts());
// { waiting: 1200, active: 0, delayed: 3, prioritized: 0,
//   'waiting-children': 0, completed: 5000, failed: 12, paused: 0 }

console.log(await queue.isPaused());
console.log(await queue.getWorkersCount());
For a single job, (await queue.getJob(id))?.getState() returns its state and await queue.getJobLogs(id) returns anything the processor logged with job.log().
From SQL (PostgreSQL backend): jobs are rows in the job table of the BullMQ schema (bullmq by default), so anyone with read access to the database can check the counts:
SELECT state, count(*) FROM bullmq.job WHERE queue = 'emails' GROUP BY state;Prioritized jobs are counted as waiting, and a paused queue is a flag in the meta table, not a job state. Only read the tables. Change jobs through BullMQ or a dashboard, because a state change also updates locks, flow dependencies and events.
Jobs stuck in waiting
Jobs in waiting are ready to run, so the question is why no worker picks them up.
No worker is connected to this queue. The dashboard shows zero workers, or getWorkersCount() returns 0. Check that the worker process is running and didn't crash on startup.
- On Redis, the worker list relies on the
CLIENT SETNAMEcommand, which some managed Redis services, such as GCP Memorystore, don't support. There the list is empty even when workers are running, both in dashboards and from code. - On PostgreSQL, each worker sets
application_nameon its connection and the list is read frompg_stat_activity. If the schema has not been initialized, workers fail withSchemaMigrationRequiredError. RunrunMigrationsas a deploy step, or passmigrate: trueon the connection.
The worker listens to a different queue. This is the most common cause. The producer and the worker must use:
- the same queue name, including case;
- on Redis, the same
prefixoption if you set one (the default isbull), and the same host, port and database number. A producer ondb: 0and a worker ondb: 1never see each other; - on PostgreSQL, the same database and the same
schema(the default isbullmq). There is no prefix on PostgreSQL; the schema is the namespace.
In a dashboard this often shows up as two queues with similar names, or as a queue that has jobs but no workers while another one has workers but no jobs. From a Redis shell, SCAN 0 MATCH bull:*:meta lists the queues. On PostgreSQL, SELECT DISTINCT queue FROM bullmq.meta does the same.
The queue is paused. The dashboard marks the queue as paused, and you can resume it from there. From code, queue.isPaused() returns true and queue.resume() resumes it. A worker can also be paused locally with worker.pause(), which affects only that worker.
The queue is rate limited. If you configured a limiter on the worker, or called worker.rateLimit(), jobs wait until the limit window expires. queue.getRateLimitTtl() returns how many milliseconds remain.
Global concurrency is reached. If you called queue.setGlobalConcurrency(n), no more than n jobs are active at once across all workers. Check queue.getGlobalConcurrency().
The worker was created with autorun: false and worker.run() was never called.
Jobs stuck in active
A job is active while a worker is processing it. The worker holds a lock on the job and renews it every lockDuration / 2 milliseconds (the lock lasts 30 seconds by default).
The processor never returns. If your function never resolves, for example because it waits on a promise that is never settled or a callback that is never called, the worker keeps renewing the lock and the job stays active forever. In the dashboard, open the job and check when it started and whether its progress or logs are still changing. Make sure every code path returns or throws, and add timeouts to network calls. For a limit on how long a job may run, see properly cancelling jobs.
The worker died. If the process crashed or was killed while running a job, nobody renews the lock. Every running worker periodically checks for jobs whose lock has expired (every stalledInterval, 30 seconds by default), moves them back to waiting and emits a stalled event. This only happens if some worker for that queue is running. If you stopped all workers, the jobs stay active until one starts again. A missing workers alert, such as the Taskforce.sh monitor, tells you when this happens instead of leaving you to notice it later.
To avoid this on deploys, close workers gracefully so they finish their current jobs first:
process.on("SIGTERM", async () => {
  await worker.close();
  process.exit(0);
});
Stalled jobs and "job stalled more than allowable limit"
A stalled job is one whose lock expired while it was active. BullMQ moves it back to waiting so another worker can run it. If the same job stalls more than maxStalledCount times (1 by default), it is moved to failed with the error job stalled more than allowable limit. You'll see this message as the failed reason in the dashboard.
The usual cause is CPU-heavy work that blocks the Node.js event loop. While your code is busy, for example parsing a very large JSON file, resizing images or running a long synchronous loop, the worker can't renew the lock. After 30 seconds the lock expires and the job is considered stalled, even though it is still running.
Ways to fix it:
- Run CPU-heavy processors in sandboxed processors, which run in a separate process or worker thread, so the main event loop stays free to renew locks.
- Break long jobs into smaller steps, for example with flows.
- Increase
lockDurationif jobs legitimately block for longer, keeping in mind that crashed jobs will then take longer to be recovered.
"Missing lock" and "Lock mismatch" errors
Errors such as Missing lock for job 1234. moveToFinished or Lock mismatch for job 1234 mean the worker finished a job but no longer owned it. On Redis you can see either one. On PostgreSQL the lock is a column on the job row, so a lost lock shows up as Lock mismatch. Common causes:
- The event loop was blocked, so the lock expired and the job was taken over by another worker. The fixes are the same as for stalled jobs.
- The worker lost its connection to the database for longer than the lock duration.
- The job, or the whole queue, was removed while it was running.
- On Redis, the lock key was evicted because
maxmemory-policyis notnoeviction. BullMQ needsnoevictionto work correctly, and logs a warning when it connects to a Redis instance with a different policy. An alert on Redis memory usage, like the Taskforce.sh max memory monitor, warns you before Redis gets full. - On PostgreSQL, the worker could not get a connection in time to renew its locks. Check that the pool size (
max) covers the worker's concurrency and that the server'smax_connectionscovers all your workers, queues and queue events, each of which also keeps one dedicatedLISTENconnection.
Jobs stuck in delayed
Delayed jobs are waiting for a timestamp: the delay you passed when adding the job, the backoff between retries, or the next run of a job scheduler. Workers move delayed jobs to waiting when they become due, so a delayed job also needs a running worker.
In a dashboard: the delayed list shows when each job is due. Use promote to run a job right away.
From code: check the job's delay and timestamp to see when it is due, and call job.promote() to run it immediately.
Jobs stuck in waiting-children
In a flow, a parent job waits in waiting-children until all of its children have completed. If a child fails, the parent keeps waiting by default.
In a dashboard: Taskforce.sh draws the flow as a graph, including children in other queues, so you can see which children are still pending or have failed.
From code: job.getDependencies() and job.getDependenciesCount() on the parent tell you which children are unprocessed or failed.
The options failParentOnFailure, ignoreDependencyOnFailure, removeDependencyOnFailure and continueParentOnFailure on the children control what happens to the parent when a child fails.
Failed jobs
A failed job keeps the reason it failed. In a dashboard, open it to see the error, the stack trace, the number of attempts and its logs. From code, read job.failedReason, job.stacktrace and job.attemptsMade.
Jobs only move to failed after using all their attempts, so if a job fails often because of temporary errors, set attempts and backoff when adding it:
await queue.add("send", data, {
  attempts: 5,
  backoff: { type: "exponential", delay: 1000 },
});
Once you have fixed the cause, retry the jobs. In a dashboard, retry a single job or use retry all on the failed list. From code:
await job.retry(); // one job
await queue.retryJobs({ state: "failed" }); // all failed jobs
If an error means retrying is pointless, for example invalid input, throw an UnrecoverableError so the job fails right away without using its remaining attempts.
Production checklist
Most stuck-job problems can be prevented with a few settings. The Going to production and PostgreSQL backend guides explain them in more detail.
On Redis:
- Set
maxmemory-policy noevictionand turn on persistence (AOF). - Use
maxRetriesPerRequest: nullfor worker connections so they wait for Redis to come back instead of throwing.
On PostgreSQL:
- Run
runMigrationsas a deploy step before workers start, and again when you upgrade BullMQ. - Size the pool (
max) for each worker's concurrency, and the server'smax_connectionsfor all workers, queues and queue events plus theirLISTENconnections. - Keep the database close to the workers, since round-trip latency limits throughput.
On both:
- Attach listeners for the
errorevent on workers, queues and queue events, and log them. - Close workers gracefully on
SIGTERMandSIGINT. - Keep CPU-heavy work in sandboxed processors or split it into smaller jobs.
- Configure
removeOnCompleteandremoveOnFailso old jobs don't fill up Redis, or grow the PostgreSQL tables and their vacuum work. - Set
attemptsandbackofffor jobs that call external services. - Set up a dashboard for production before you need it, so you can inspect, retry and promote jobs without deploying code.
- Alert on failed jobs, missing workers and growing backlogs, so you find out about stuck queues before your users do. You can build this with BullMQ's events and Prometheus metrics, or use the built-in monitors in Taskforce.sh.